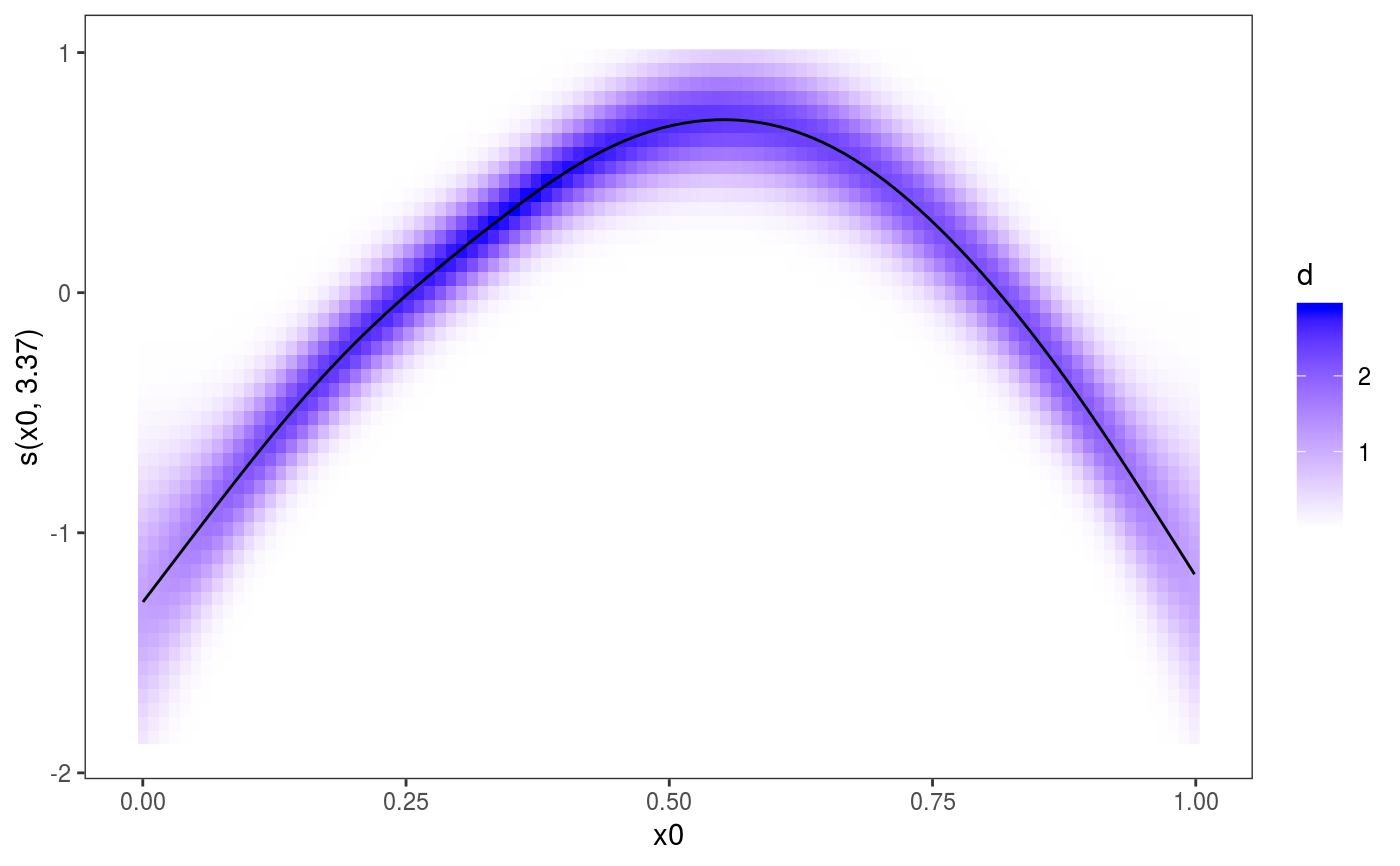
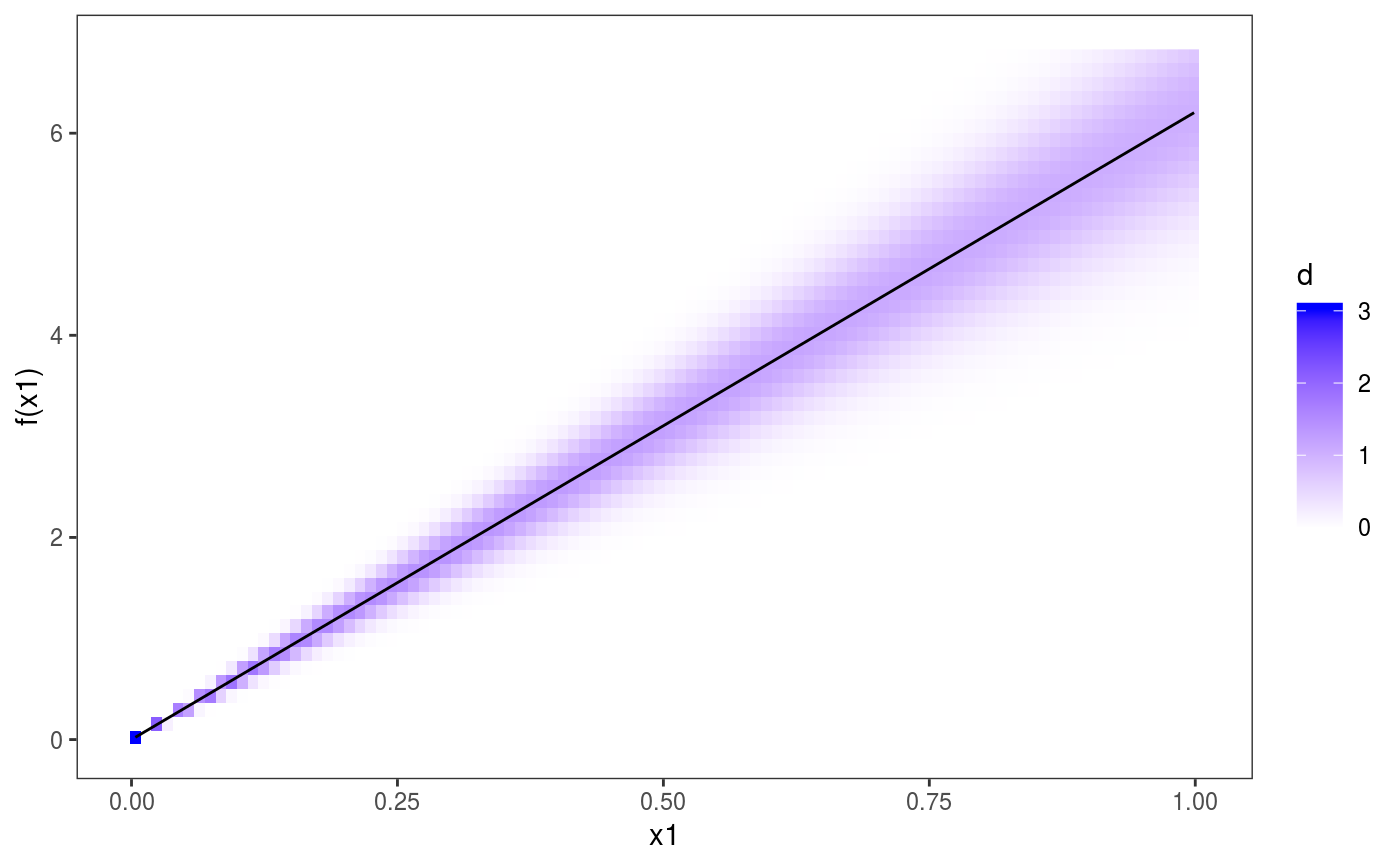
This layer adds a conditional posterior density strip to 1D smooth effects plots. With the default colour scale, the opacity is proportional to the conditional density of the fitted effects, under the usual Gaussian approximation the posterior.
l_fitDens(n = 50, level = 0.95, trans = identity, ...)
Arguments
| n | sqrt of the number of grid points used to compute the effect plot. |
|---|---|
| level | confidence level. By default the conditional density of the fit will be plotted
between the Gaussian quantiles 0.025 and 0.975, hence the |
| trans | monotonic function to be applied to the density of the fit, which determines colour of the plot. Monotonicity is not checked. |
| ... | further arguments to be passed to |
Value
An object of class gamLayer.
Details
See Bowman (2018) for explanations about the advantages of density strips, relative to plots including the mean fit + confidence intervals.
References
Bowman, D. W (2018). Graphics for uncertainty. Journal of the Royal Statistical Society: Series A.
Examples
#> Gu & Wahba 4 term additive model