Plotting random effects
Source:R/plot_multi_random_effect.R, R/plot_random_effect.R
plot.random.effect.RdThis is the plotting method for random effects (simple random intercepts).
# S3 method for multi.random.effect
plot(x, trans = identity, ...)

# S3 method for random.effect
plot(x, trans = identity, ...)
Arguments
| x | a random effect object, extracted using mgcViz::sm. |
|---|---|
| trans | monotonic function to apply to the fit, confidence intervals and residuals, before plotting. Monotonicity is not checked. |
| ... | currently unused. |
Value
An object of class plotSmooth.
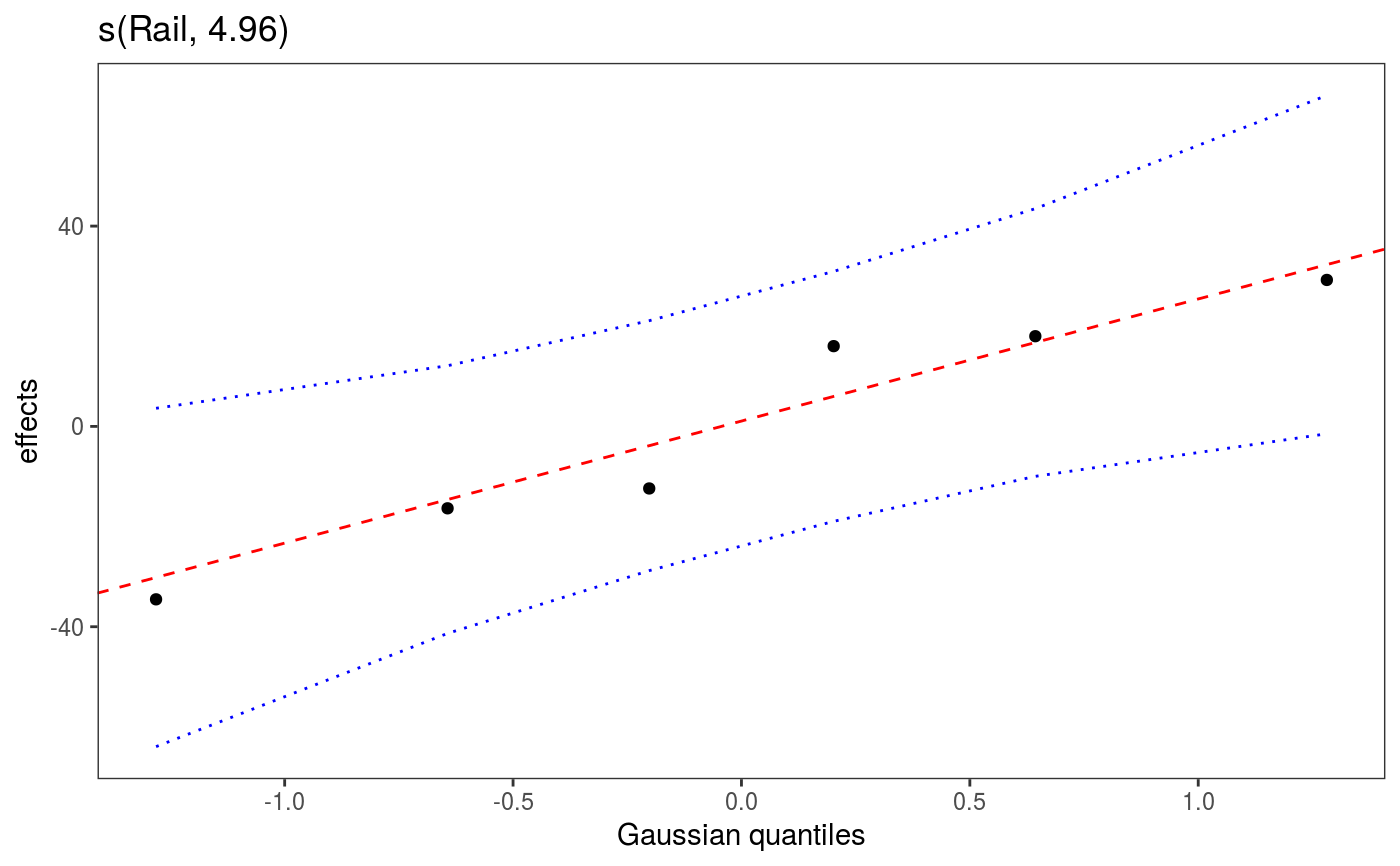
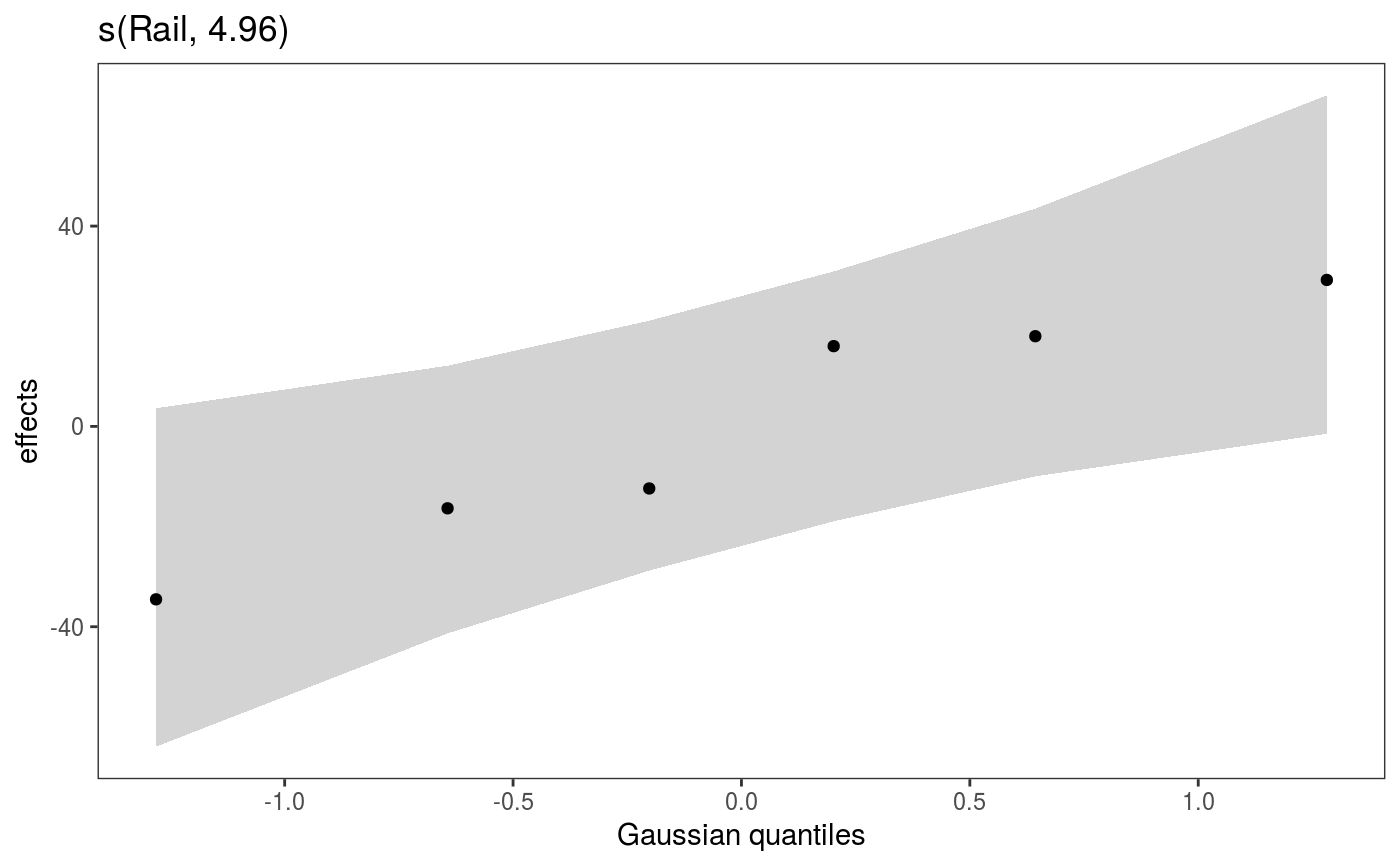
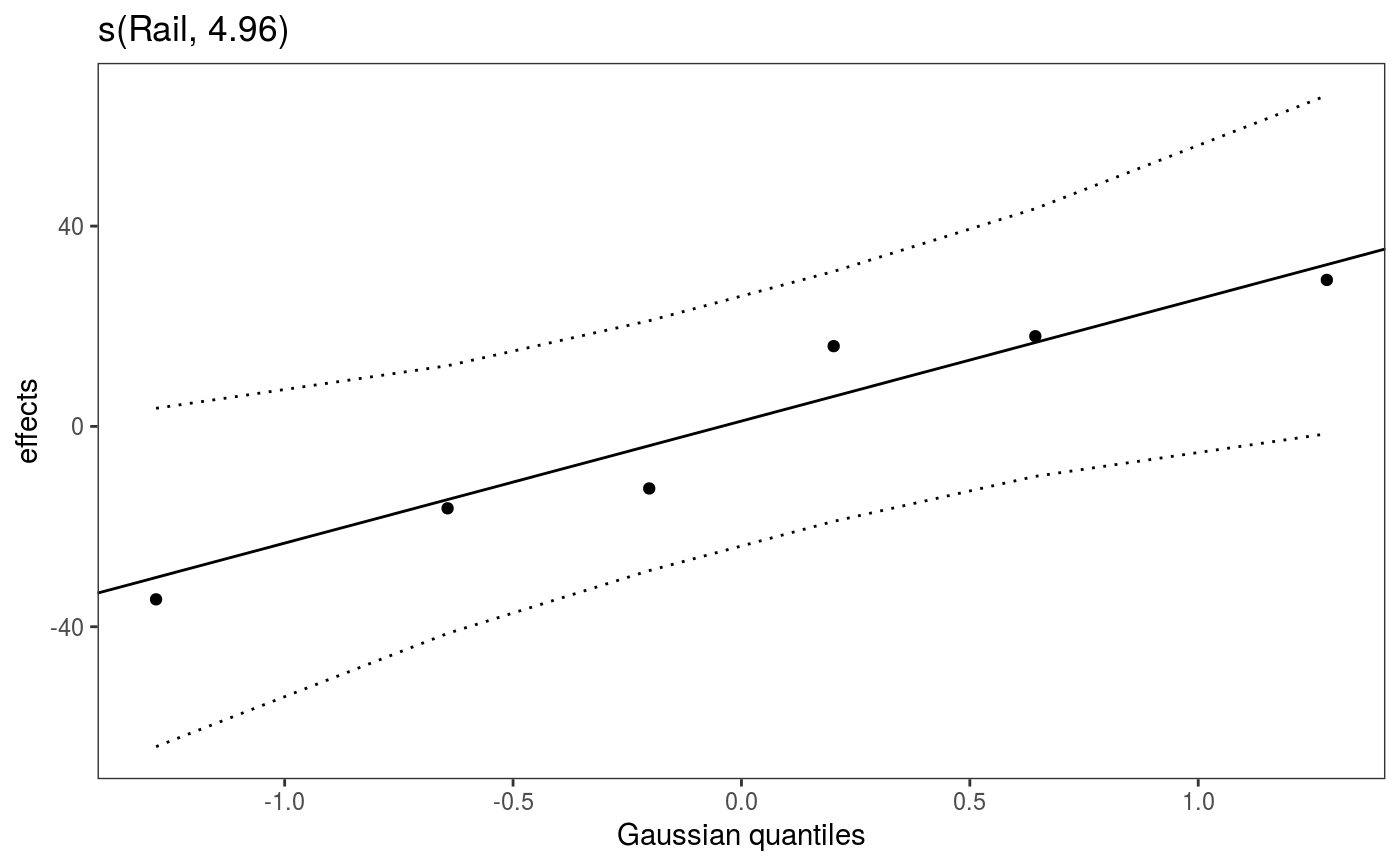
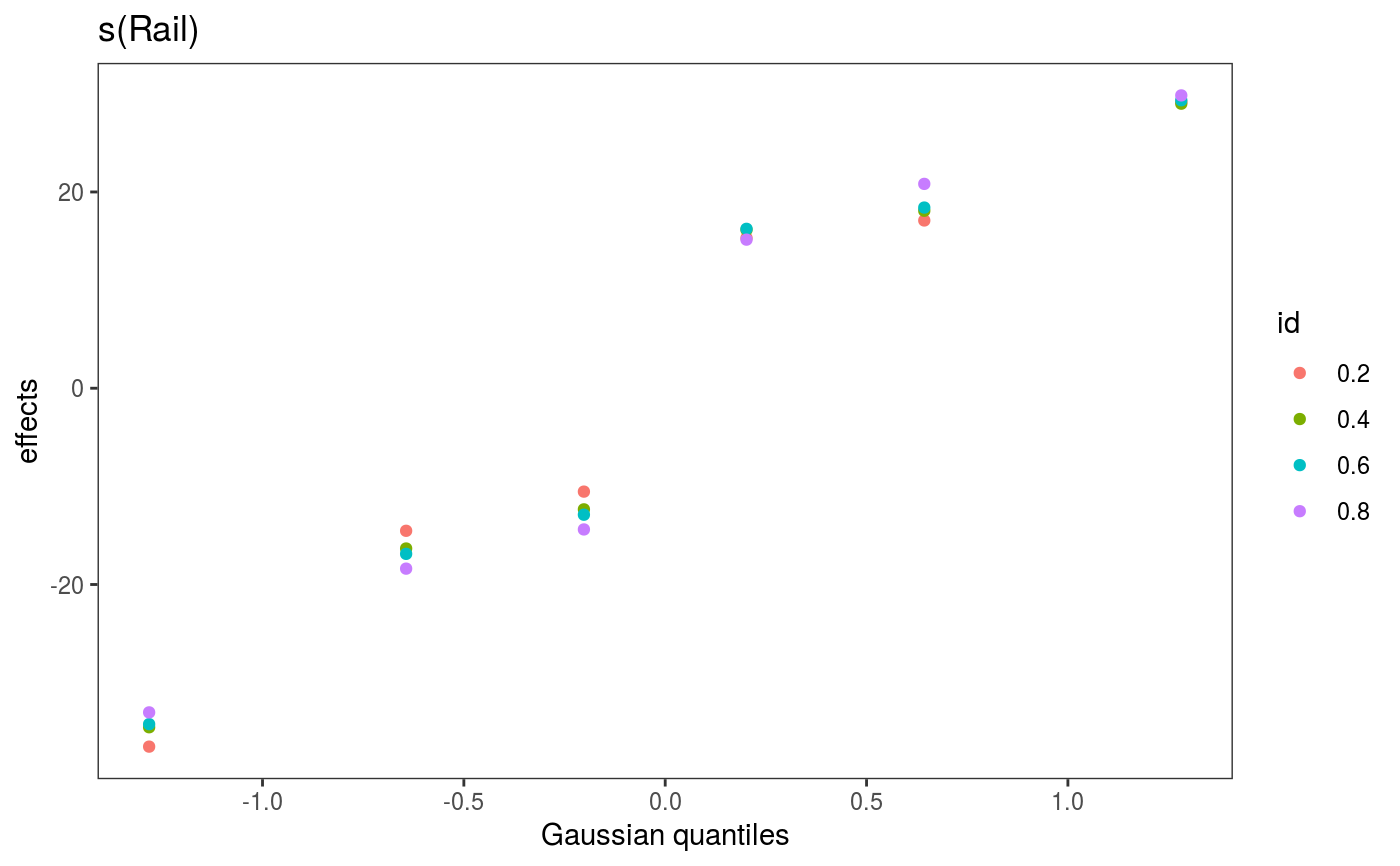
Examples
library(mgcViz) b <- gam(travel~s(Rail,bs="re"), data=Rail, method="REML") b <- getViz(b) plot(sm(b, 1)) + l_fitLine(colour = 2, linetype = 2) + l_points() + l_ciLine(colour = 4, linetype = 3)### # Quantile GAM version ### b <- mqgamV(travel~s(Rail,bs="re"), data=as.data.frame(Rail), qu = c(0.2, 0.4, 0.6, 0.8))#> Estimating learning rate. Each dot corresponds to a loss evaluation. #> qu = 0.4.........done #> qu = 0.6..........done #> qu = 0.2...............done #> qu = 0.8...............done#> Warning: No l_ciPoly() layer available for type "Multi RandomEffect"