This is a re-write of the QQ-plotting functions provided by stats, using the
ggplot2 library.
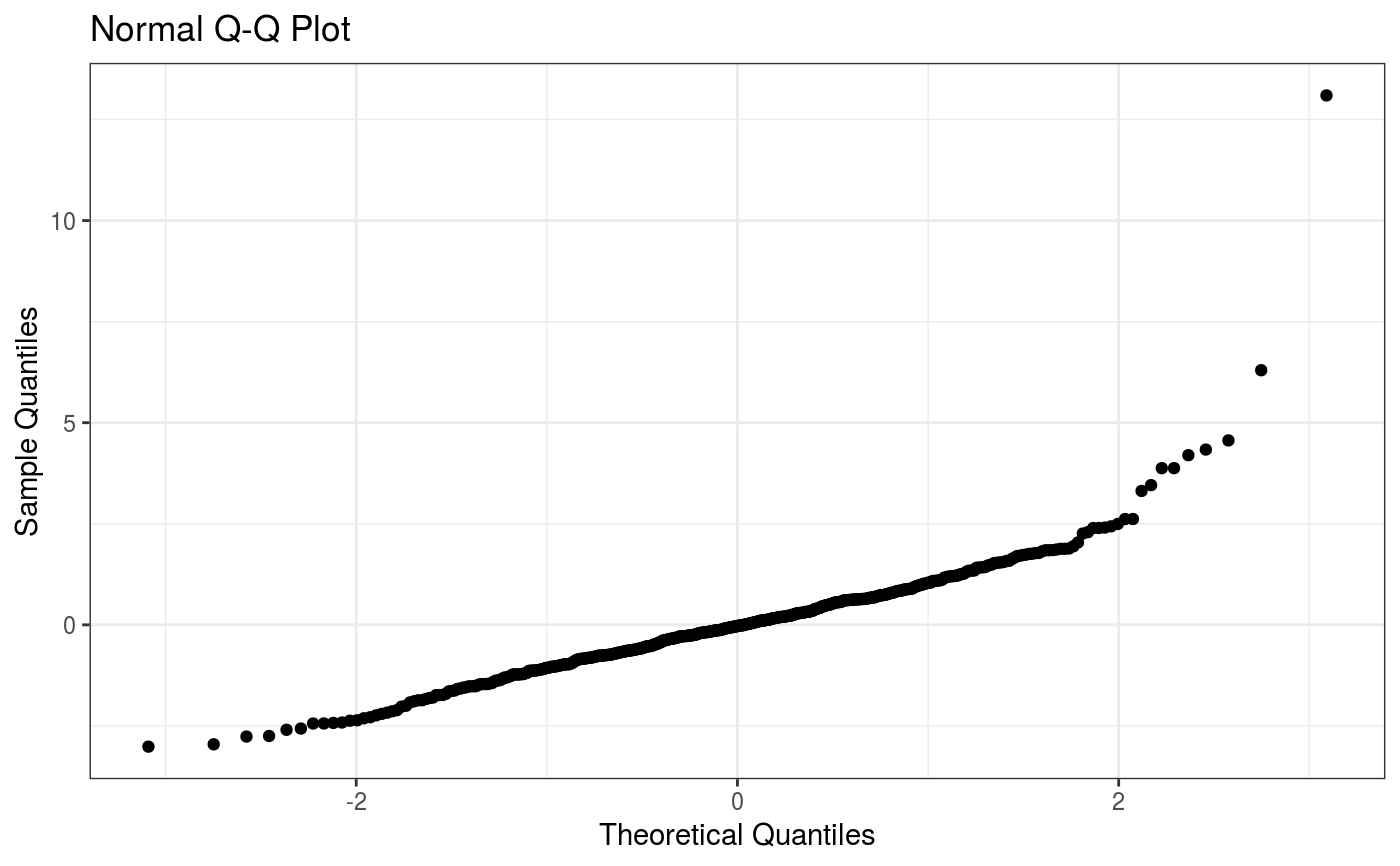
qqnorm is a generic function the default method of which produces a normal
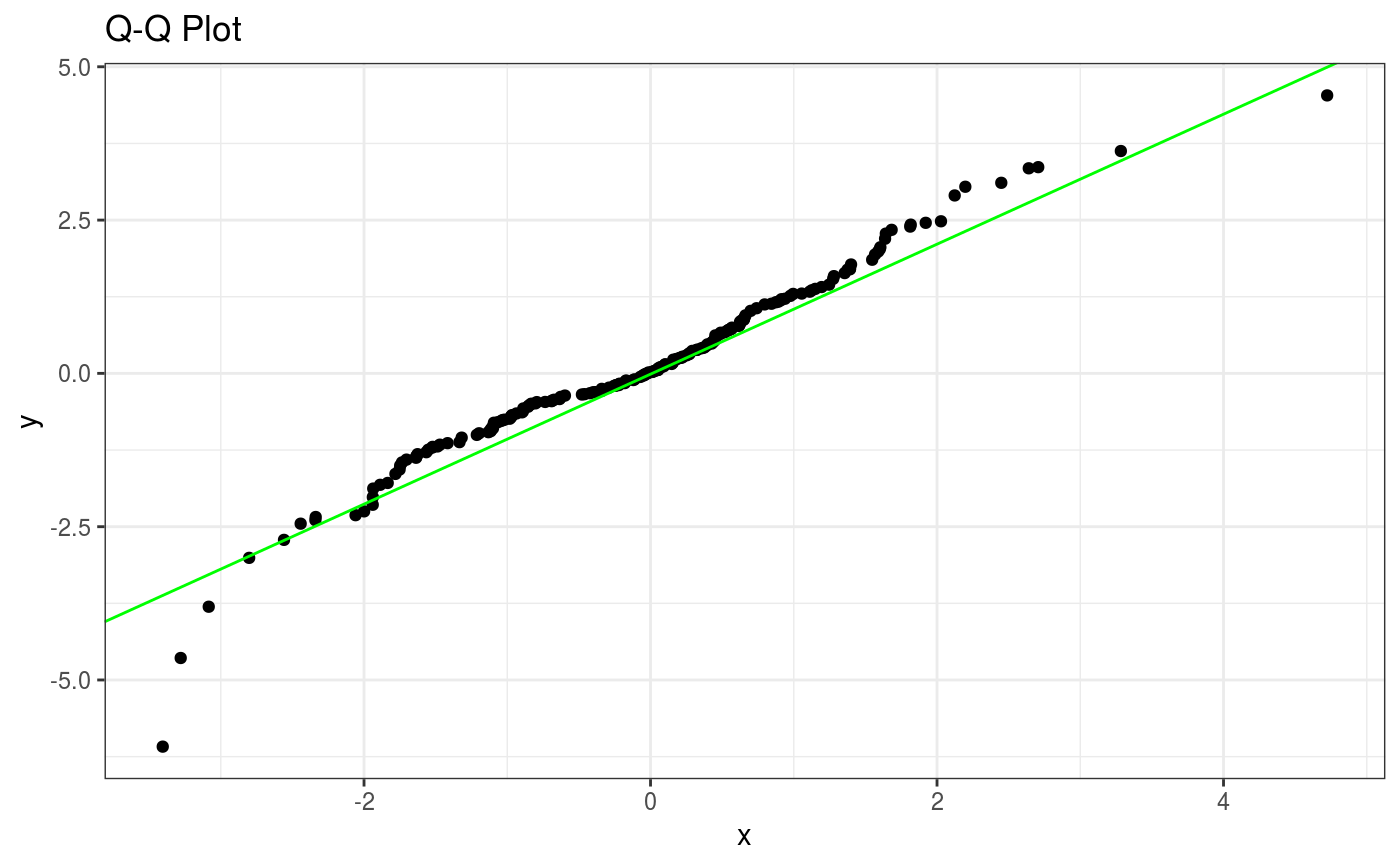
QQ plot of the values in y. qqline adds a line to a “theoretical”, by default normal,
quantile-quantile plot which passes through the probs quantiles, by default the
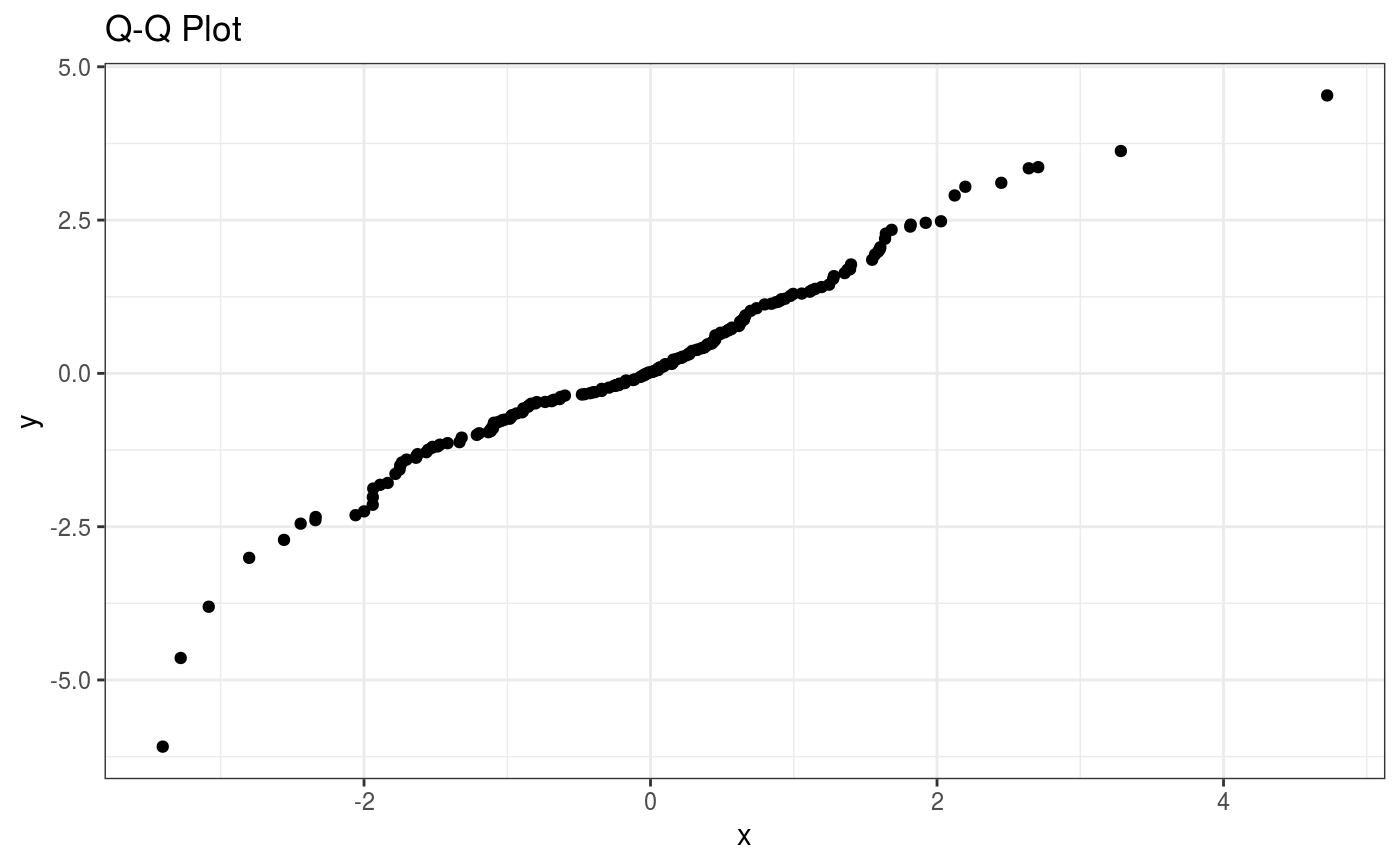
first and third quartiles. qqplot produces a QQ plot of two datasets.
qqnorm(
  y,
  ylim,
  main = "Normal Q-Q Plot",
  xlab = "Theoretical Quantiles",
  ylab = "Sample Quantiles",
  datax = FALSE
)

qqplot(
  x,
  y,
  xlab = deparse(substitute(x)),
  ylab = deparse(substitute(y)),
  main = "Q-Q Plot"
)

qqline(
  y,
  datax = FALSE,
  distribution = qnorm,
  probs = c(0.25, 0.75),
  qtype = 7,
  ...
)
Arguments
| y, | The second or only data sample. |
|---|---|
| ylim, ..., | Graphical parameters. |
| main, xlab, ylab, | Plot labels. The xlab and ylab refer to the y and x axes respectively if datax = TRUE. |
| datax, | Logical. Should data values be on the x-axis ? |
| x, | The first sample for |
| distribution | quantile function for reference theoretical distribution. |
| probs | numeric vector of length two, representing probabilities. Corresponding quantile pairs define the line drawn. |
| qtype | the type of quantile computation used in quantile. |
Note
Help file is mainly from stats::qqnorm since this is a rewrite of stats::qqplot,
stats::qqline and stats::qqnorm using the ggplot2 library.
Examples
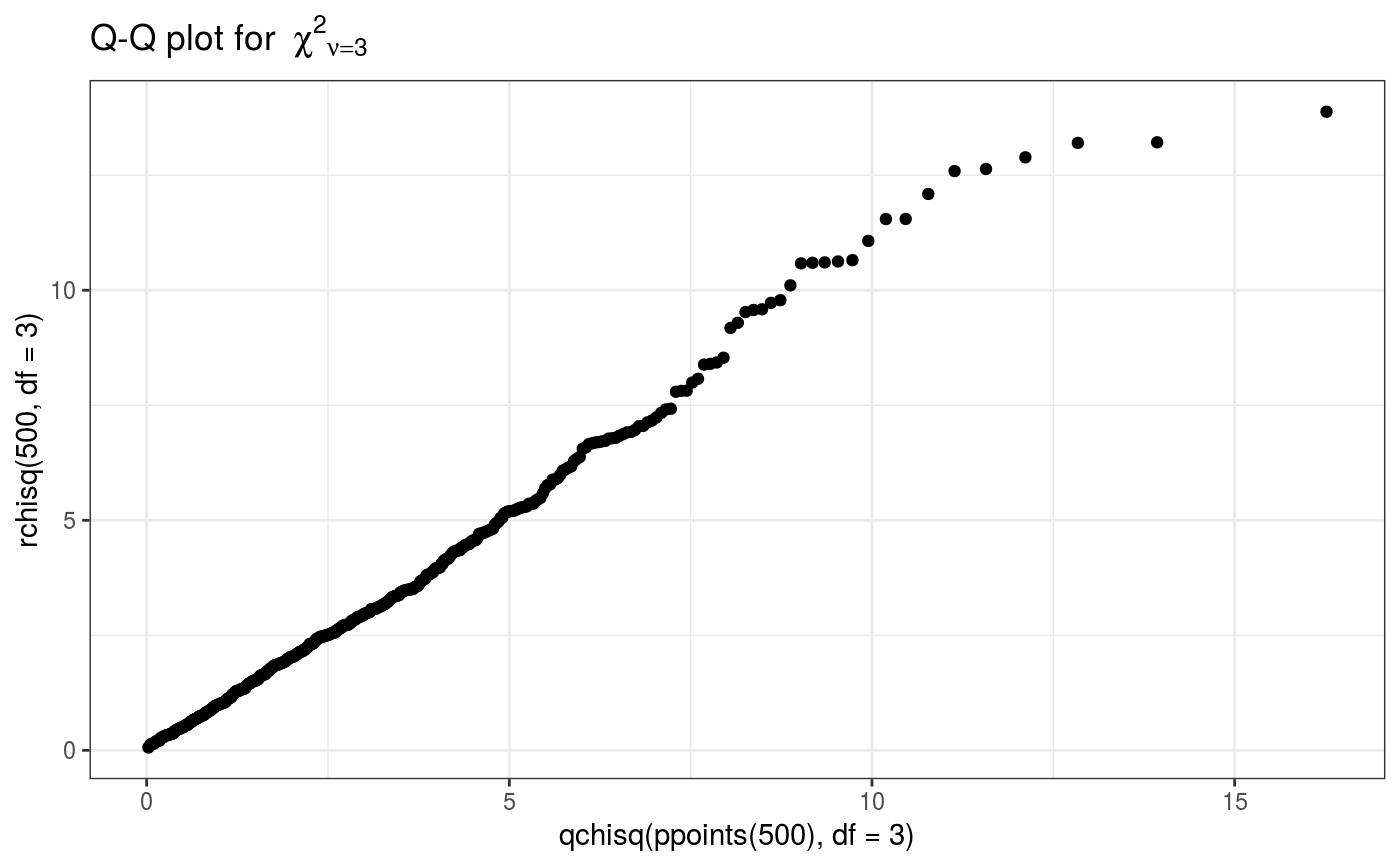
qqnorm(y)# Compare new and old version of qqplot x <- rt(200, df = 5) y <- rt(300, df = 5) stats::qqplot(x, y)qqplot(x, y)## "QQ-Chisquare" : -------------------------- y <- rchisq(500, df = 3) ## Q-Q plot for Chi^2 data against true theoretical distribution: x <- qchisq(ppoints(500), df = 3) stats::qqplot(qchisq(ppoints(500), df = 3), rchisq(500, df = 3), main = expression("Q-Q plot for" ~~ {chi^2}[nu == 3]))qqplot(qchisq(ppoints(500), df = 3), rchisq(500, df = 3), main = expression("Q-Q plot for" ~~ {chi^2}[nu == 3])) + theme_bw()