These are wrapper that fits a QGAM model using qgam::qgam and
converts it to a gamViz object using the getViz function.
It is essentially a shortcut.
qgamV(form, data, qu, lsig = NULL, err = NULL, aQgam = list(), aViz = list())
Arguments
| form, data, qu, lsig, err | same arguments as in qgam::qgam. |
|---|---|
| aQgam | list of further arguments to be passed to qgam::qgam. |
| aViz | list of arguments to be passed to getViz. |
Value
An object of class "gamViz" which can, for instance, be plotted using plot.gamViz.
Examples
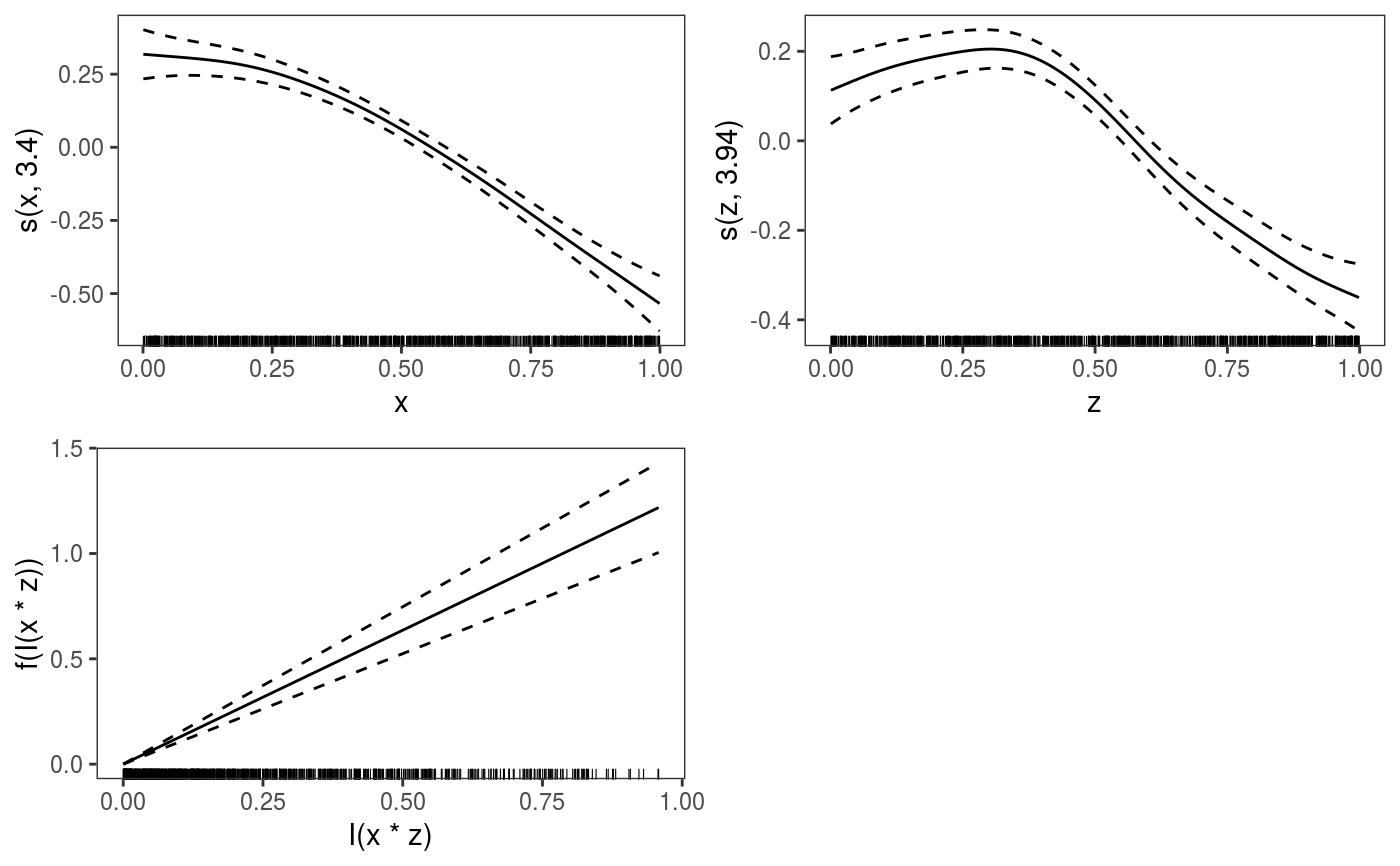
library(mgcViz) set.seed(2) ## simulate some data... dat <- gamSim(2,n=1000,dist="normal",scale=0.25)$data#> Bivariate smoothing example# Fit GAM and get gamViz object b <- qgamV(y~s(x) + s(z) + I(x*z), data = dat, qu = 0.2, aQgam = list(argGam = list(select = TRUE)), aViz = list("nsim" = 0))#> Estimating learning rate. Each dot corresponds to a loss evaluation. #> qu = 0.2........done# This is equivalent to doing # 1. Fit QGAM # b <- qgam(y~s(x) + s(z) + I(x*z), data=dat, qu = 0.2, argGam = list(select = TRUE)) # 2. Convert to gamViz object # b <- getViz(b, nsim = 0) # Either way, we all effects by doing print(plot(b, allTerms = TRUE), pages = 1)